CGR Critical Raw Materials
Measuring the circularity of critical raw materials
The analysis follows each material across the full value chain: from primary extraction and refining, through semi-fabrication and finished product manufacturing, into use, and finally through collection, sorting, remanufacturing, secondary refining, and end-of-life disposal where applicable. An overview of these material flows is provided in the Sankey diagram.
Methodological approach
The analysis combines two complementary modelling approaches: dynamic material flow analysis and system dynamics.
Dynamic material flow analysis (dMFA) extends conventional material flow analysis by modelling how material stocks and flows evolve over time, in this case the period of 2020–2050. Rather than providing a snapshot of material use in a single year, dMFA captures how materials accumulate in products and infrastructure, how long they remain in use, and when they reach end-of-life and enter waste and recycling flows, potentially becoming available as secondary materials.
This model tracks in-use stocks by year of entry. Each annual inflow of material into use is treated as a distinct cohort with its own expected lifetime. Future outflows are then calculated by applying lifetime probability profiles across all historical cohorts. This approach enables the model to estimate not only how much material is currently locked into stock, such as buildings, machinery, vehicles, and electronics, but also when these materials are likely to reach end-of-life and potentially become available for recovery.
The dMFA layer is complemented by a system dynamics (SD) layer, which captures how markets respond to changing supply and demand conditions. Four behavioural mechanisms are represented:
- Scarcity-price-demand: captures how physical stress in the system influences demand levels.
- Capacity envelope: governs how end-of-life waste collection and processing capacity expands or contracts in response to sustained system pressure.
- Collection response: reflects how end-of-life waste collection activity increases when prices and scarcity rise and returns toward baseline when pressure eases.
- Strategic reserve: represents the potential drawdown or replenishment of strategic inventories.33
Together, these two layers represent the physical and behavioural dimensions of the system. The dMFA layer describes material availability and constraints, while the SD layer captures responses from markets and institutions. The two are loosely coupled, exchanging information until the system reaches a stable outcome: behavioural responses influence demand and collection activity, while material availability determines whether supply can meet demand.
Scenario architecture
The baseline projects global supply and demand dynamics to 2050 based on historical trends and current assumptions for material efficiency, product lifetimes, and recycling performance. To explore the potential contribution of circular economy strategies at the system level, the model tests alternative scenarios across three dimensions:
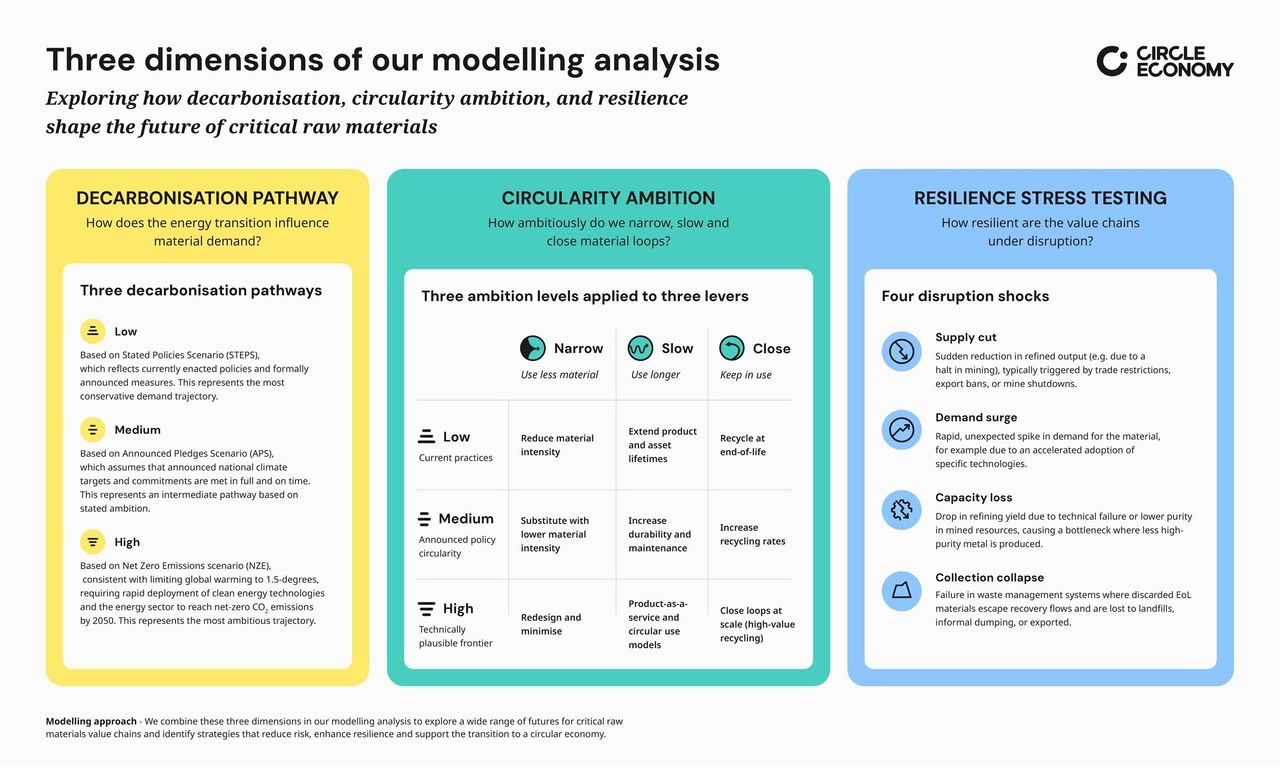
Figure one: Overview of the Scenario Architecture.
Together, the baseline and scenario architecture addresses three central questions:
- How much projected demand can the global system realistically supply?
- How dependent is future supply on primary versus secondary material sources?
- To what extent can circularity close supply-demand gaps and improve the system's resilience to disruption?
Key considerations and limitations
As with any system-level model, the findings presented in this report should be interpreted in the context of several methodological choices and scope limitations.
A full description of the modelling approach, including underlying data sources, parameterisation choices, and equations, is provided in the accompanying Methodology Document.
Overview of the analytical framework
The framework combines established approaches to material flow analysis and criticality assessment, adapted to the structure of the coupled model described above. The report examines the supply, demand, and material flow dynamics through different analytical lenses, each corresponding to a distinct part of the material system. To support interpretation, these lenses are organised into four categories: 1) Supply, demand, and resilience; 2) Upstream; 3) Midstream; and 4) Downstream. The first category provides a cross-cutting, overarching view of supply chain performance and resilience. The remaining three categories correspond to upstream, midstream, and downstream stages commonly used in material flow analysis and supply chain management. The figure below illustrates how the supply chain stages are mapped in this analysis.
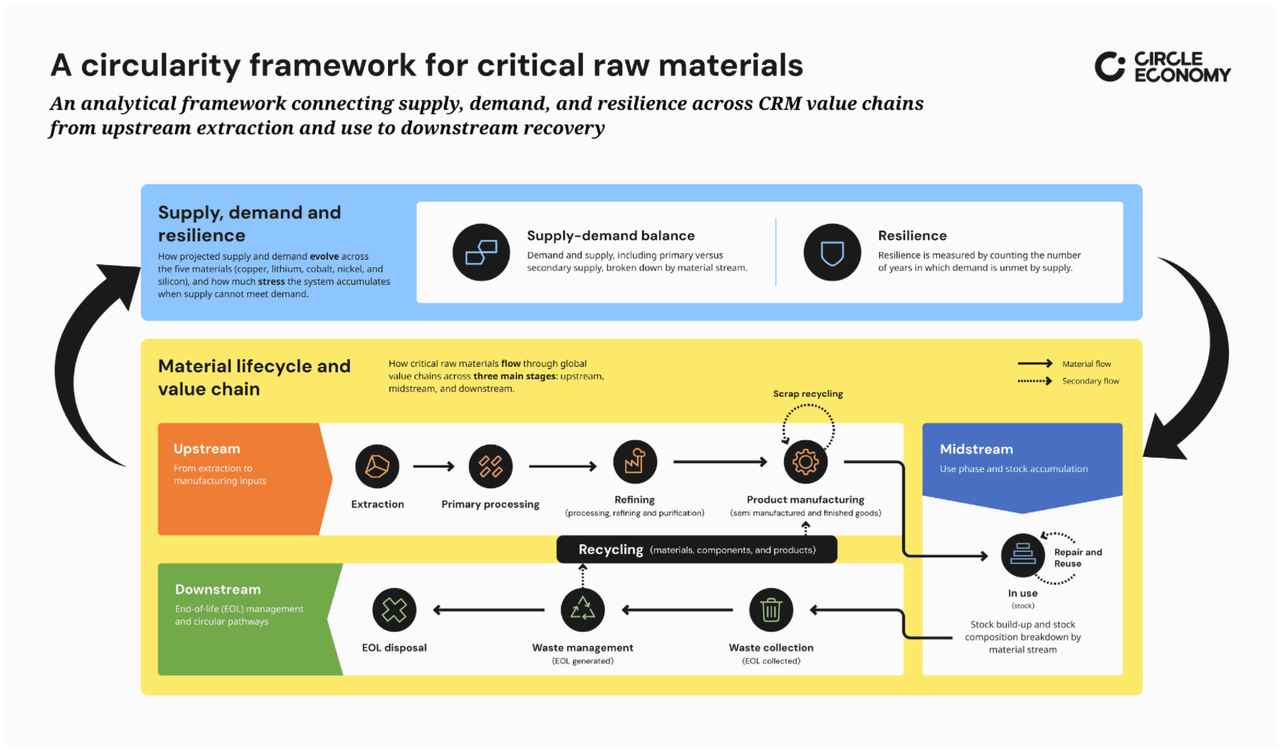
Figure two: The analytical framework used for assessing circularity of CRMs—material life cycle and value chain, and how it connects to supply, demand and resilience.
Together, these four thematic categories provide the structure for interpreting the nine indicators presented in Chapter three, both for each individual material and, where appropriate, across all five materials.
References
- 31. Some of these materials are also more concretely linked, such as cobalt which is a by-product of nickel and copper (among other metals), and therefore expressly tied to their production and supply dynamics. International Renewable Energy Agency (IRENA). (2023). Geopolitics of the energy transition: Critical materials (Rep.). Abu Dhabi: IRENA. Retrieved from: IRENA website
- 32. Primary supply is nonetheless not held rigidly at the base case. Where demand and the resulting price signals pull, supply can rise above the anchor through a marginal supply mechanism, bounded by a material-specific price elasticity. These elasticities are low—ranging from 0.10 for copper to 0.33 for lithium—so the anchor continues to dominate the trajectory, but supply is responsive at the margin rather than fixed.
- 33. Strategic reserves, also known as stockpiling, involves governments and major economies building emergency reserves of specific critical raw materials to protect supply chains, hedge against price fluctuations, and secure materials for key industries such as defense and green technologies. In the model, this is operationalised as a strategic reserve outflow—material drawn from a government or industry buffer stockpile to bridge supply gaps during periods of stress.
- 34. As detailed, these pathways are framed around decarbonisation ambition and do not account for all sources of future critical raw material demand. Other notable drivers of demand growth, such as, digital infrastructure and advanced manufacturing, are not fully accounted for in the scenarios. The results should be interpreted with this in mind, as future pressures on material systems, and the potential contribution of circularity are only partially captured. The trajectory of other demand sources depends on future technological developments, policy decisions, and consumption choices.
- 35. Based on the Stated Policies Scenario (STEPS) by the IEA. Source.
- 36. Based on the Announced Pledges Scenario (APS) by the IEA. Source.
- 37. Based on the Net Zero Emissions by 2050 Scenario (NZE) by the IEA. Source.
- 38. Using Best Available Techniques (BAT) as an a prior assumption in quantitative research allows investigators to establish an optimised, standardised baseline for predictive modeling, techno-economic assessments, and environmental impact studies.
- 39. The IEA's Global Critical Minerals Outlook 2025 is the base source for all CRMs analysed, with the exception of silicon. The study does not focus on silicon, therefore more expansive data on silicon was used. Demand is built from the United States Geological Survey (USGS) production and end-use statistics supplemented with industry-association data (Semiconductor Industry Association, Global Silicones Council) and IEA's own end-use breakdowns; while supply is derived from the International Resource Panel's Global Material Flows Database (domestic silica extraction), calibrated against USGS silicon production statistics.
- 40. The two recycling indicators used in this report count functional recycling only, excluding material recovered into lower-value applications as well as material returned to service through reuse or remanufacturing. The recycling input rate (RIR) includes both old scrap, recovered from products reaching end of life, and new scrap generated during manufacturing, and is calculated at global scale. It should not be read as equivalent to the European Commission's end-of-life recycling input rate (EOL-RIR), which counts only secondary material from old scrap and measures inputs to the EU rather than to the global system. Values reported here will therefore tend to exceed EOL-RIR figures for the same material, reflecting the boundary of the indicator rather than stronger recycling performance. The "end-of-life" prefix is deliberately not applied to the RIR in this report, since the indicator includes material that has not passed through a use phase. JRC. (2018). Towards Recycling Indicators based on EU flows and Raw Materials System Analysis data. Retrieved from: JRC website
The Circularity Gap Report is an initiative of Circle Economy, an impact organisation dedicated to accelerating the transition to the circular economy.
© 2008 - Present | RSIN 850278983