Norway

Norway's Circularity indicator set
The previous analysis quantified Norway’s global impact by examining its material and carbon footprint, accounting for all types of materials flowing in and out of its economy. Yet, to truly understand the state of circularity in Norway, we need to look deeper—not just at the quantities but at how these materials are used. To address this, we use the Circularity Indicator Set, which captures the full spectrum of inputs into Norway’s economy. It differentiates circular inputs, like secondary materials and carbon-neutral biomass, from linear inputs, such as fossil fuels and non-recycled materials. It also tracks stock build-up—materials used for buildings and infrastructure that are added to long-term reserves and won’t re-enter circulation for many years.
By using this methodology, we aim to answer critical questions: How much material is Norway adding to its stock annually? How much biomass is being consumed? By providing these insights, the Circularity Indicator Set enables local stakeholders to track circular performance over time, set meaningful goals, and steer future actions.
For a detailed explanation of each indicator, please refer to the Methodology Document.
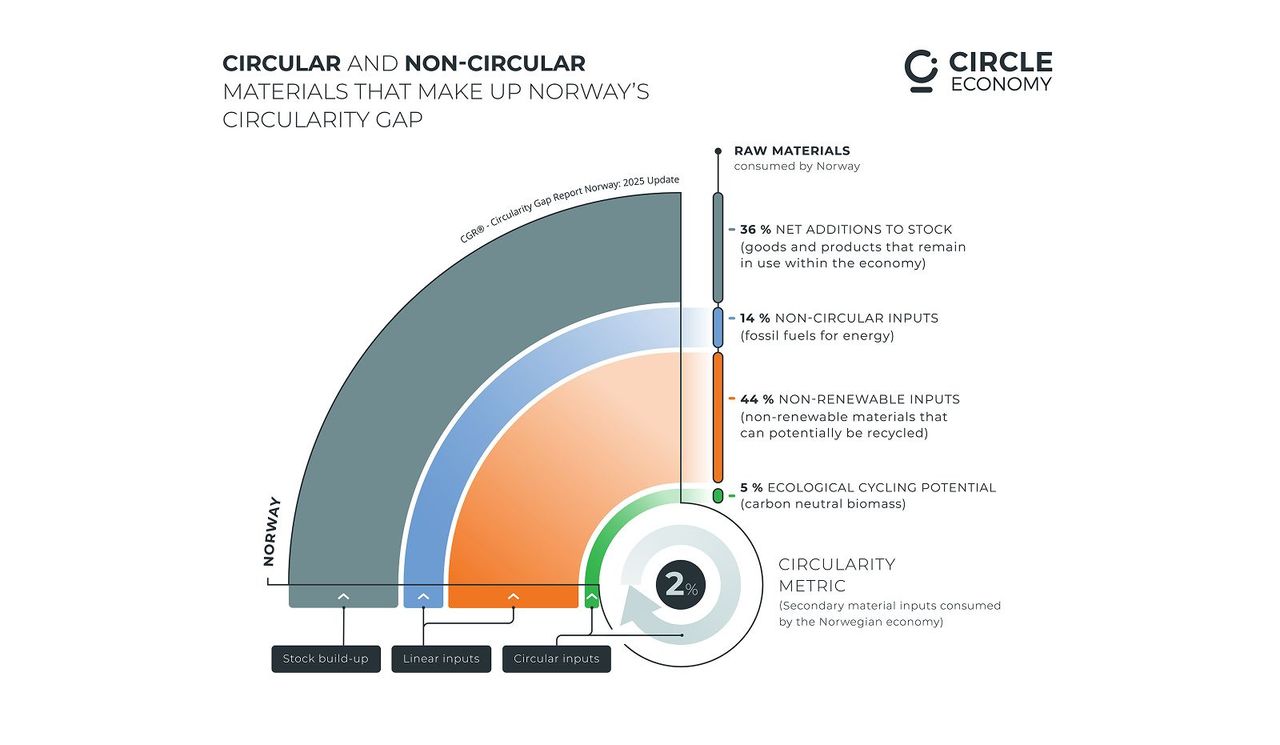
Figure two depicts the Circularity Indicator Set, showing the full spectrum of inputs into Norway’s economy.

Table one shows the breakdown of Norway’s circular inputs within the Circularity Indicator Set for 2022 and 2018, plus the percentage of change over time.
Circular inputs
These are the materials flowing into an economic system that contribute to a circular economy. This means they're used in a way that prioritises reuse, recycling, and regeneration over virgin extraction and waste disposal. This category includes two indicators: the Technical Cycling rate (or 'Circularity Metric') and the Ecological Cycling Potential rate.
1. Technical Cycling Rate (Circularity Metric)
The Technical Cycling rate, or the ‘Circularity Metric’, refers to the share of secondary materials in an economy's total consumption. It accounts for all materials that were formerly waste but are cycled back into use, including recycled materials from both the technical cycle (such as recycled cement and metals) and recycled processed biological inputs (such as paper and timber).
Technical cycling rate
in 2022
What does this mean for Norway?
At 2%, Norway’s Technical Cycling Rate is low compared to the global average of 7.2%.[41] This means only 2% of Norway’s material consumption (4.3 million tonnes) comes from cycled materials, unchanged since 2018. Increased secondary material use has been offset by rising virgin material consumption. However, informal reuse and unmeasured activities could mean that this figure is slightly higher in reality.
Secondary materials primarily come from domestic recycling (4.2 million tonnes), including biomass (0.8 million tonnes), non-metallic minerals (1.9 million tonnes), metals (1.1 million tonnes), and fossil fuels (0.4 million tonnes), with 0.2 million tonnes contributed by backfilling. Adjusting for net export of direct by-product reuse (0.1 million tonnes) results in 4.3 million tonnes of secondary material consumption.
Norway has a negative trade balance in secondary materials, exporting 2 million tonnes while importing 1.1 million tonnes, lowering its circular input levels.
2. Ecological Cycling Potential Rate
The Ecological Cycling Potential rate captures the share of primary biomass (such as trees, manure, food products or agricultural residues) out of total material consumption that is considered carbon-neutral as a minimum criterion.
Ecological cycling potential rate
in 2022
What does this mean for Norway?
Norway’s Ecological Cycling Potential is limited, with carbon-neutral biomass making up only 5% of total material consumption—well below the global average of 21%.[42]
The majority of biomass consumption is linked to food products. Of Norway’s total biomass material footprint (45.2 million tonnes), the top contributors are Food Processing (17.3 million tonnes), Construction (4.6 million tonnes), Crop Farming (3.8 million tonnes), Public Services (3.6 million tonnes), and Hotels and Restaurants (2.7 million tonnes), collectively accounting for 71% of total biomass use.
Linear inputs
Linear inputs make up the Circularity Gap: they’re materials that follow a take-make-dispose model and aren’t cycled back into either technical or ecological systems. This category comprises three indicators: the Non-Renewable rate (materials that could be recycled but currently are not), the Non-Circular rate (fossil fuels used for energy), and the Non-Renewable Biomass rate.
1. Non-renewable rate
Non-Renewable Inputs include metals, plastics, paper, glass and other materials found in everyday products. They do not include fossil fuels or any biomass other than paper and wood. Contrary to Technical Cycling, this category represents materials that can potentially be cycled but are currently not, whether in Norway or abroad.
Non-renewable rate
in 2022
What does this mean for Norway?
Norway relies heavily on raw materials that could be replaced with secondary materials. Non-Renewable Inputs account for 44% of its material consumption, highlighting significant potential to increase technically-cycled inputs. Of Norway’s Non-Renewable Inputs, two-thirds are sourced through net extraction abroad, with 29% of total material consumption resulting in waste generated outside its borders. This underscores the critical role of supply chain engagement in promoting sustainable resource use through trade. The rate has risen from 31% in 2018, reflecting a growing reliance on non-renewable materials and an opportunity to expand the use of technically cycled materials. Furthermore, improving second-hand and secondary materials markets is essential—all products handled locally must be successfully collected, sorted, and processed for re-entry into the Norwegian economy or abroad, preventing their disposal in landfills or incineration.
2. Non-circular rate
This category centres on fossil-based energy carriers, such as coal, oil and natural gas, among others. These fuels are burnt mainly for energy and, to a lesser extent, to produce chemicals and plastics. As they combust, they release GHG emissions into the atmosphere. These material inputs cannot be cycled and are therefore inherently non-circular.
Non-circular rate
in 2022
What does this mean for Norway?
Norway’s economy remains reliant on fossil fuels for energy, which account for 14% of total material inputs—slightly below the global average of 15%.[43] Encouragingly, this is a decrease from 18% in 2018, reflecting progress in reducing fossil fuel reliance. However, as the most impactful material group, further reductions are critical to mitigate climate change.[44]
Norway leads in transitioning to cleaner energy, but fossil fuels still dominate final energy consumption. While electricity, namely hydropower, is nearly entirely renewable (98%),[45] it accounts for only 54% of final energy use, with the rest reliant on fossil fuels. Additionally, imported goods are largely manufactured using fossil fuel-based energy. Since 1990, total energy consumption has grown by 17%, compounding the energy transition challenge.[46]
Efforts must focus on energy-intensive sectors. In manufacturing, despite an electrification rate of 63%, fossil fuels dominate the remaining energy use. Similarly, in transport, despite an uptick in electric vehicles,[47] electricity represents only 6% of final energy consumption, with oil-based fuels making up the majority.[48] Meeting renewable energy targets requires a major shift in these sectors.
Stock build up
This category includes a single indicator that measures the share of virgin material flows being added to global stocks—such as buildings, infrastructure, machinery, and vehicles—in net terms. These materials are locked into long-lived assets and unavailable as secondary material inputs for many years or even decades, with this delay creating a temporal gap or ‘lag’ in circularity.
Net additions to stock
Many of the materials that are needed to meet Norway’s material demand feed into goods that remain in use for a relatively long time, such as buildings, infrastructure, machinery and vehicles.[49] These materials are added to the material reserves of an economy for longer than a year and are therefore referred to as Net Additions to Stock.
Stock build up
in 2022
What does this mean for Norway?
Norway’s stocking rate is moderate for a European economy, standing at 36%, slightly below the global average of 38%. This global rate is largely driven by rapid stock buildup in emerging economies. Compared to 2018, Net Additions to Stock form a smaller share of Norway’s total consumption, reflecting reduced growth in the construction and durable consumer goods sectors—typical for economies with more mature infrastructure.
Norway’s stocking rate per capita is high at 14 tonnes, compared to Sweden (10 tonnes), Ireland (8 tonnes), and the UK (3 tonnes). This aligns with Norway’s lower population density, where buildings and infrastructure are inherently less resource-efficient.
Regional comparison

Table two compares between countries that have a Circularity Metric Indicator Set.
The Circularity Gap Report is an initiative of Circle Economy, an impact organisation dedicated to accelerating the transition to the circular economy.
© 2008 - Present | RSIN 850278983