Norway

Material flows and footprints
To truly understand an economy’s environmental footprint, it's essential to consider not only local impacts but also those abroad. For this reason, this study takes a consumption-based approach to calculate Norway’s material and carbon footprints. Instead of just looking at where materials are extracted or goods are produced, the material footprint reflects the total raw materials used to meet Norway’s consumption needs, no matter where those resources come from. [28] Similarly, the carbon footprint is measured by considering the GHG emissions tied to the consumption of goods and services in Norway. This includes both direct emissions, such as those from heating homes, and the emissions embedded in the international trade of goods, like imports. By adopting this perspective, we gain a clearer and more comprehensive picture of Norway's true contribution to global resource consumption and GHG emissions.
Norway’s material flows
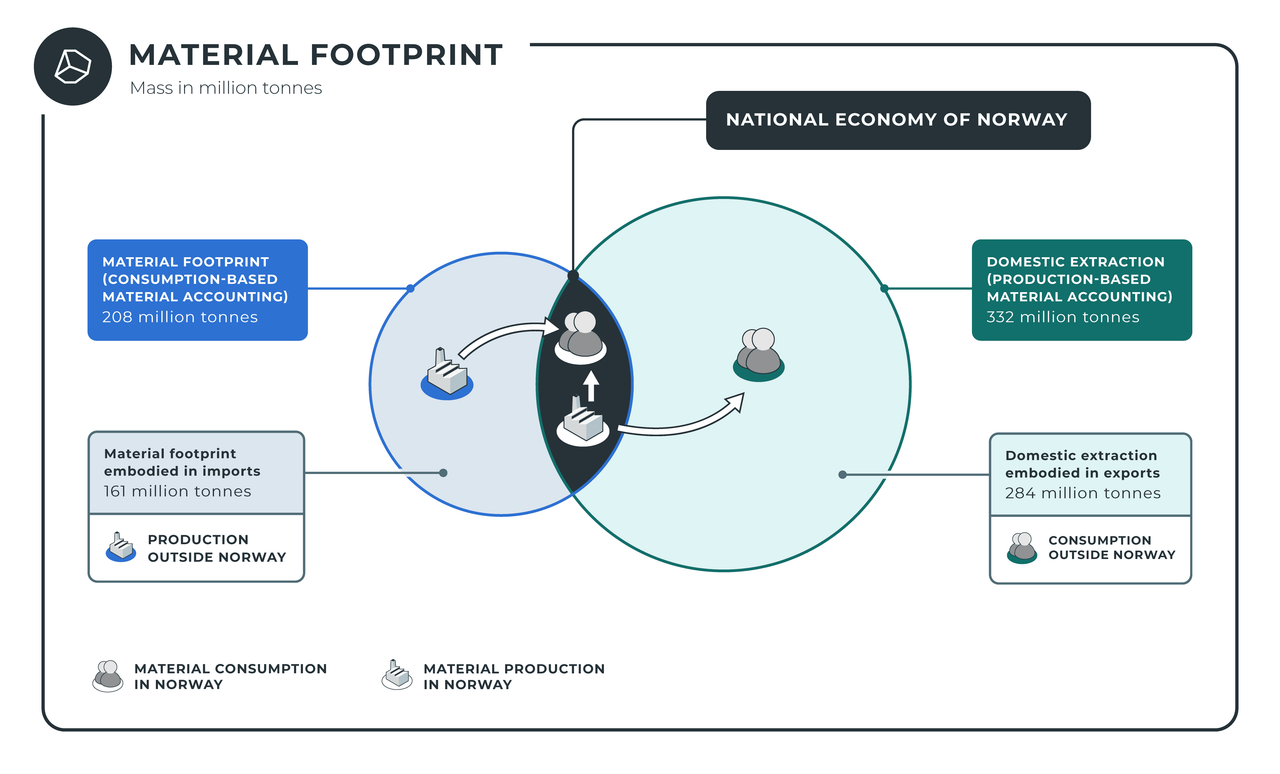
We apply the concept of socioeconomic metabolism to track the flows of materials and energy through Norway’s economy, recognising that economies function like living systems, continuously transforming resources into goods, services, and waste. The sankey diagram pictured in Figure three allows us to visualise how materials—both virgin and secondary—are extracted or imported, processed by various industries, and eventually consumed by sectors of final demand, which correspond to societal needs such as housing and mobility. This image highlights that Norway’s import footprint (161.1 million tonnes) is just under half that of the export footprint (284.3 million) pointing to the country’s export-driven nature. This is primarily driven by fossil fuel extraction and export.
It’s important to note that in Figure three, the material consumption of the societal needs includes both virgin and secondary materials. In the following sections, material footprints for various societal needs include only virgin material consumption. This is why you may not notice a discrepancy between the value presented in Figure three and those reported on in the rest of this section.
Figure three depicts Norway’s material flows.
Norway, as a sparsely populated high-income nation, relies heavily on international trade, making its economy both import-dependent and material- and carbon-intensive. High levels of material consumption, typical of affluent countries, drive significant GHG emissions through energy-intensive extraction, transportation, and production processes. Although Norway extracts substantial raw materials domestically, the majority are exported, contributing to its global material and carbon footprint. These patterns of consumption, extraction, and emissions underscore the complexities and challenges Norway must address to transition to a low-carbon, resource-efficient economy.
Domestic extraction
tonnes per capita in 2021
Domestic extraction
Domestic extraction measures the raw materials physically removed from the natural environment to fuel an economy, expressed in weight and excluding water and air.[29] While it serves as a foundation for economic activity, this process comes at a steep environmental cost, driving pollution, biodiversity loss, and the depletion of natural carbon sinks. These impacts occur regardless of whether the extracted resources are consumed domestically or exported for use abroad.
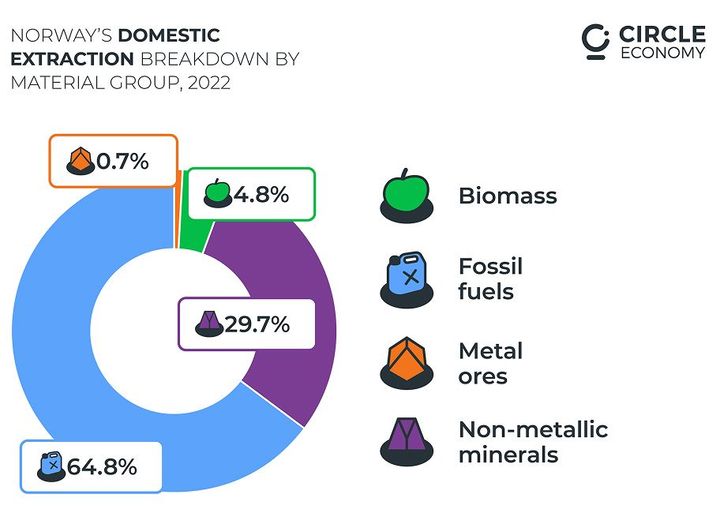
Figure four displays domestic extraction by material group in 2022.
In Norway, domestic extraction rose from 323 million tonnes in 2018 to 332 million tonnes in 2022, reflecting a 3% increase. However, on a per capita basis, this figure remained steady at 61 tonnes per person due to a proportional rise in population during this period. The extraction profile continues to be dominated by fossil fuels—natural gas and crude oil—accounting for 65% of the total in 2022, slightly up from 63% in 2018. Despite the majority of these being exported, their extraction impacts are felt locally. Non-metallic minerals, primarily used in construction, represented the second-largest share, holding steady at 30% across both years. Biomass and metal ores made up 5% and 1% of domestic extraction, respectively, with minimal change over time. These figures illustrate the scale and composition of Norway’s domestic resource extraction.
Material footprint
tonnes per capita in 2021
The material footprint captures the total raw materials required throughout the entire supply chain to meet an economy’s demand for goods and services, regardless of where extraction, processing, or disposal occurs. As a consumption-based indicator, it reflects the environmental impact of an economy’s consumption habits, both domestically and abroad.
In Norway, the material footprint grew from 197 million tonnes in 2018 to 208 million tonnes in 2022, marking a 6% increase. However, the trends behind this rise vary across sectors, a dynamic explored further in the sectoral contribution section. Additionally, the origin of the material footprint has shifted significantly. In 2022, 22% of the footprint originated from within Norway, while 77% came from abroad. This represents a notable change from 2018 when 31% of materials were sourced domestically and 69% internationally. This shift towards outsourcing material extraction—and the associated environmental impacts—to other regions is examined in greater detail in the regional contribution section.
Carbon footprint
tonnes per capita in 2021
To fully understand an economy’s environmental impact, measuring its material footprint is not enough. While the material footprint highlights the effects of material consumption both domestically and internationally, assessing the carbon footprint is equally critical. A consumption-based carbon footprint captures the GHG emissions tied to the goods and services consumed by a person, industry, or national economy. By accounting for the emissions embodied in imports and exports, this approach offers a comprehensive view of an economy's true contribution to global emissions, surpassing the insights of production-based accounting.
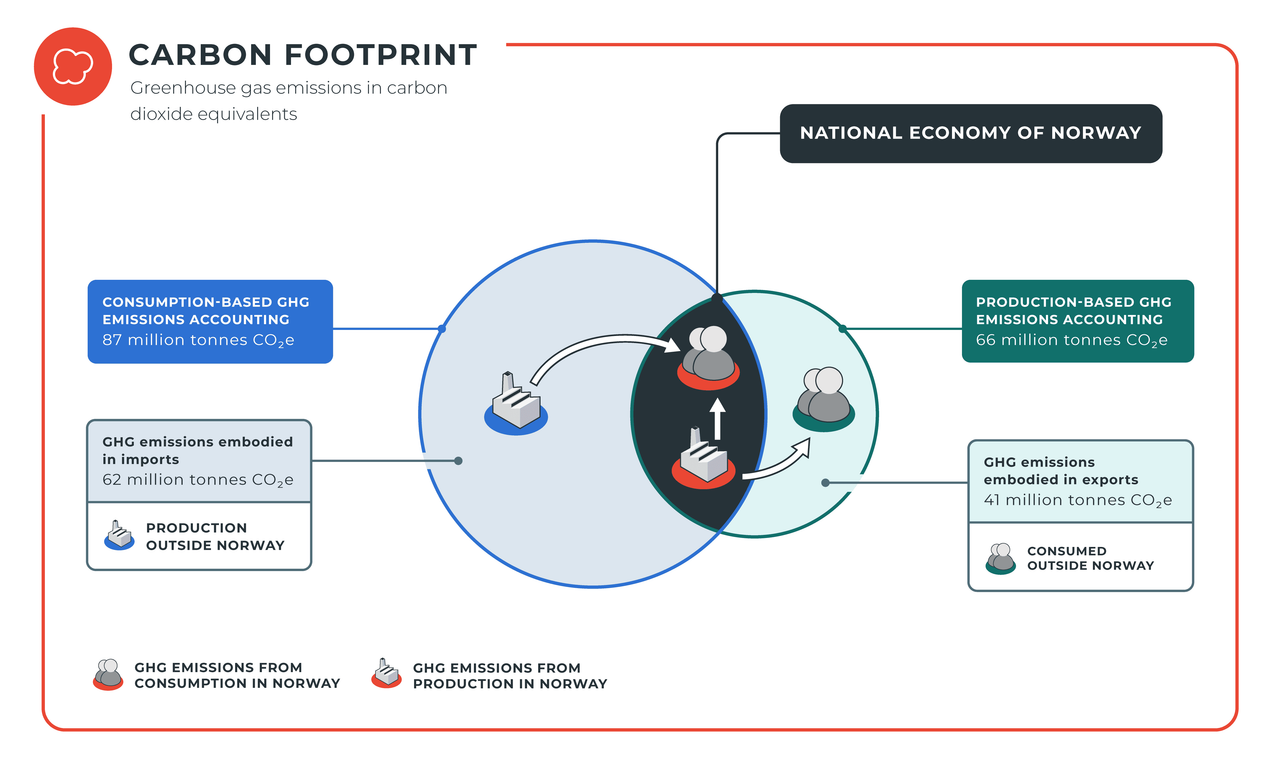
In Norway, the carbon footprint remained steady at 87 million tonnes of CO2e—or 16 tonnes of CO2e per capita—between 2018 and 2022. However, the distribution of emissions shifted over this period. In 2022, 19% of the carbon footprint originated domestically, with 71% tied to international sources. This marks a change from 2018 when 34% of emissions came from within Norway and 66% from abroad, indicating a growing reliance on emissions-intensive production outside the country. Sectoral contributions also shifted during this period: this is explored further in the sectoral contribution section, while the implications of this geographic shift are detailed in the regional contribution section.
Regional comparison

Table three compares national and global figures for material extraction and the material and carbon footprints. Note that these figures have been rounded off and drawn from different data sources and years and are, therefore, not directly comparable. The figures are intended to broadly illustrate Norway’s position within the EU and global contexts.
Regional contribution
The geographical implications of natural resource use are complex and diverse. Tracking material flows across borders reveals important insights into the spatial distribution of environmental impacts, particularly where a country's footprint is concentrated.
While Norway is making progress in meeting domestic climate targets, this shift is pushing the environmental burden onto other nations, contributing to global climate breakdown. This underscores a flaw in the Paris Agreement—which focuses only on domestic emissions—allowing high-consuming countries like Norway to meet their targets while inadvertently exacerbating environmental challenges abroad.
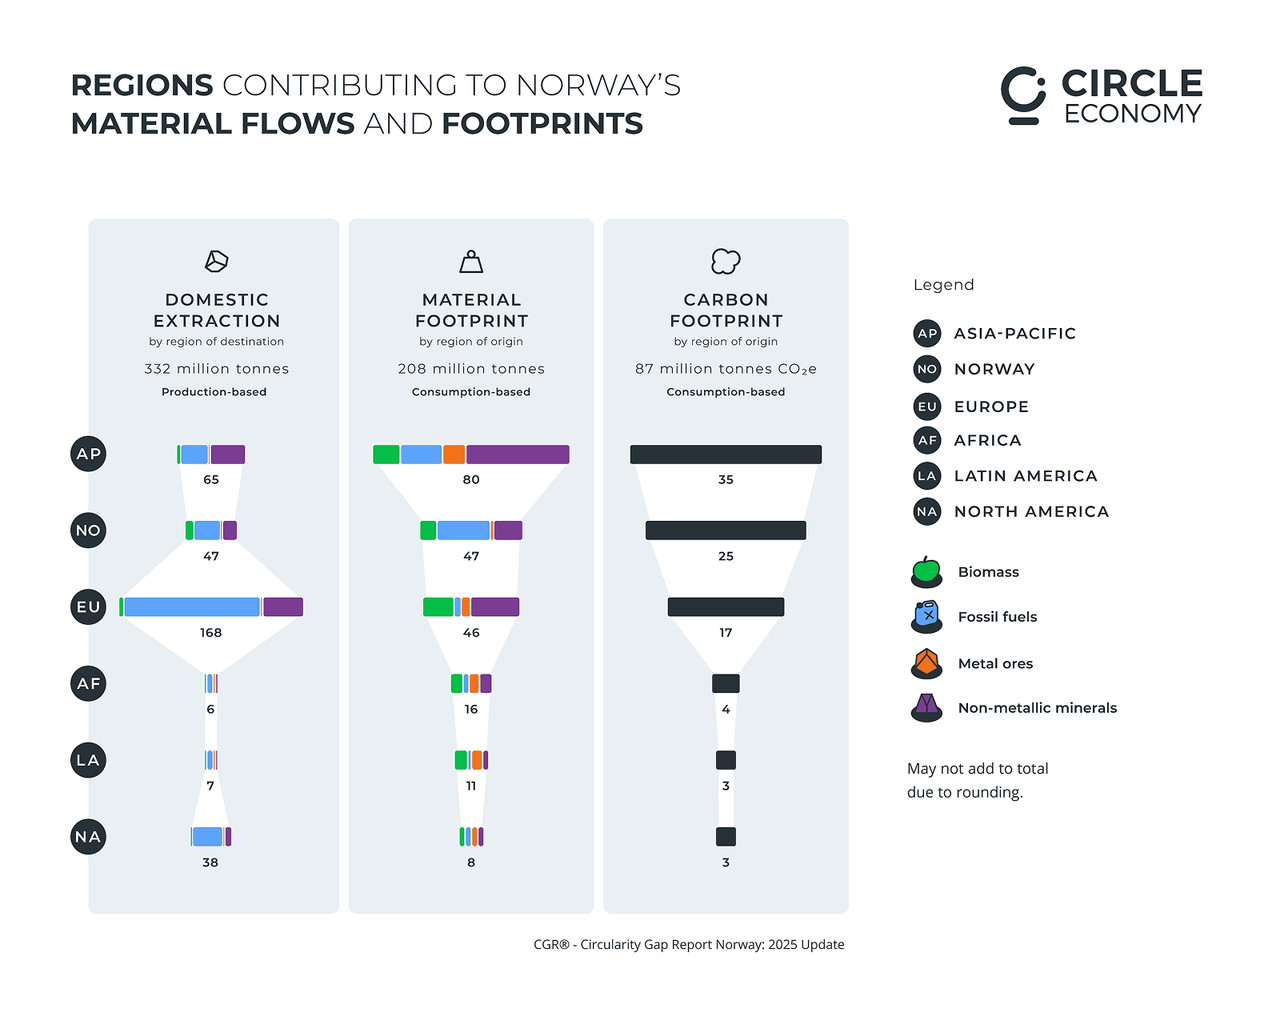
Figure five depicts how various world regions contribute to Norway’s material and carbon footprints, and how the materials extracted in Norway are used across the world.
Norway's material footprint, which measures the total amount of materials extracted to meet the nation's consumption demands, has shifted significantly in recent years. In 2022, domestic material extraction in Norway accounted for 23% of the country’s material footprint (47 million tonnes), a decrease from 61 million tonnes in 2018. Meanwhile, 38% of Norway’s material footprint (80 million tonnes) originated from material extraction in the Asia-Pacific region in 2022, up from 69 million tonnes in 2018. The rest of Europe accounted for 22% (46 million tonnes) of Norway’s material footprint, a significant increase from 38 million tonnes in 2018.
The material footprint linked to Africa and Latin America remained relatively stable. Africa accounted for 8% (16 million tonnes), up from 12 million tonnes in 2018, while Latin America represented 5% (11 million tonnes), a modest increase from 10 million tonnes in 2018. Finally, North America contributed 4% (8 million tonnes) of the total material footprint, up from 7 million tonnes in 2018.
A similar trend can be observed in Norway’s carbon footprint, which reflects the GHG emissions associated with material extraction. In 2022, 40% (35 million tonnes of CO2e) of Norway’s carbon footprint was tied to material extraction in the Asia-Pacific region, a notable increase from 31 million tonnes of CO2e in 2018. Domestically, 29% (25 million tonnes of CO2e) of Norway’s carbon footprint was linked to Norwegian material extraction, remaining relatively stable from 29 million tonnes of CO2e in 2018. Material extraction in the rest of Europe contributed 20% (17 million tonnes of CO2e) of Norway's carbon footprint, a consistent figure compared to 17 million tonnes of CO2e in 2018. Africa’s contribution was 4% (4 million tonnes of CO2e), up from 3 million tonnes of CO2e in 2018, while North America and Latin America both accounted for 4% (3 million tonnes of CO2e) each. These figures have remained stable compared to 3 million tonnes of CO2e in 2018.
The Circularity Gap Report is an initiative of Circle Economy, an impact organisation dedicated to accelerating the transition to the circular economy.
© 2008 - Present | RSIN 850278983