
Brazil


Brazil's circularity indicator framework
This analysis takes a deeper look at how materials are used within Brazil’s economy through our Circularity Indicator Set (Figure 14), which categorises all material inputs as Circular (such as secondary materials and potentially circular biomass), Linear (including fossil fuels and non-recycled materials), or Stock build-up (buildings and infrastructure that lock materials away for years).
This approach helps answer key questions: How much material is added to Brazil’s stock each year? How much biomass is being consumed? By tracking these flows, local stakeholders can monitor circular performance over time, set meaningful targets, and steer decision-making towards a more resource-efficient and resilient economy. For a full breakdown of each indicator, please refer to the Methodology Document. To better understand the practical challenges encountered in quantifying circularity see Appendix B under Methodology document.
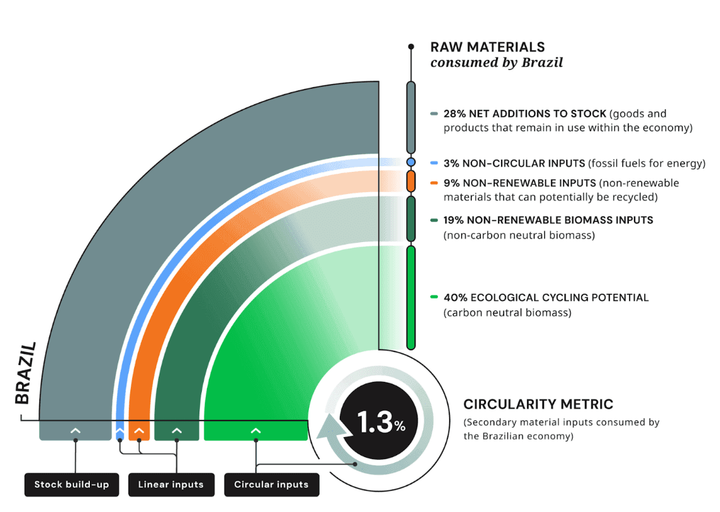
Figure 14 shows the full picture of circular and non-circular materials that make up Brazil’s Circularity Gap.
Circular inputs
These are the materials flowing into an economic system that contribute to a circular economy. This means they're used in a way that prioritises reuse, recycling, and regeneration over virgin extraction and waste disposal. This category includes two indicators: the Technical Cycling rate (or 'Circularity Metric') and the Ecological Cycling Potential rate.
1. Technical Cycling Rate (Circularity Metric)
The Technical Cycling rate, or the ‘Circularity Metric’, refers to the share of secondary materials in an economy's total consumption. It accounts for all materials that were formerly waste but are cycled back into use, including recycled materials from both the technical cycle (such as recycled cement and metals) and recycled processed biological inputs (such as paper and timber).
These are inputs that should be aimed to be maximised as much as possible.
What does this mean for Brazil?
At just 1.3%, Brazil’s Technical Cycling Rate is well below the global average of 6.9%. [75] Of the 4.1 billion tonnes of materials consumed, only a small fraction comes from secondary sources—indicating limited recycling infrastructure and a continued dependence on virgin material extraction. [76]
Most secondary materials come from non-metallic minerals (49.9%), biomass (32%), metal ores (17.4%), and fossil fuels (0.7%) [77]. While bulky non-metallic minerals like limestone and gravel are often downcycled, their sheer volume makes them the largest contributor. Biomass includes organic matter such as crop residues and wood; a significant portion—around 40 million tonnes or 48.1%—comes from industrial and agricultural by-products like oil-cake from soybean processing, reflecting Brazil’s role as a major soybean exporter. [78] [79]
Construction and demolition activities account for 48.2% of secondary materials, comprising metal ores, non-metallic minerals, and some biomass. This suggests active material recovery in the construction sector, though it’s unclear how much is reused at high value. Only 3.7% of secondary inputs come from treated waste streams—municipal (1.9%), industrial (1.3%), and special waste (0.5%)—highlighting limited waste separation and processing capacity.
2. Ecological Cycling Potential Rate
The Ecological Cycling Potential rate captures the share of primary biomass (such as trees, manure, food products or agricultural residues) out of total material consumption that is considered carbon-neutral as a minimum criterion.
These are inputs that should be aimed to be maximised as much as possible.
What does this mean for Brazil?
Brazil’s Ecological Cycling Rate is well above the global average of 21%. [80] This is due to the dominance of biomass in Brazil’s material mix and the large share that qualifies as carbon neutral. Of the country’s total biomass footprint, an estimated 1.8 billion tonnes, or 66%, consists of materials like crops, wood, and low-carbon animal products that are—or have the potential to be—carbon neutral. This high rate reflects Brazil’s strong agricultural base, including soy, sugarcane, and livestock production. However, while biomass offers a lower-carbon material stream, its overall sustainability depends on responsible land management, deforestation control, and ecosystem preservation. This is particularly critical in Brazil, home to globally important biomes such as the Amazon and Cerrado, which face mounting environmental pressures. [81]
Linear inputs
Linear inputs make up the Circularity Gap: they’re materials that follow a take-make-dispose model and aren’t cycled back into either technical or ecological systems. This category comprises two indicators: the Non-Renewable rate (materials that could be recycled but currently are not), and the Non-Circular rate (fossil fuels used for energy) and the Non-Renewable Biomass Inputs.
1. Non-renewable rate
The Non-Renewable rate includes metals, plastics, paper, glass and other materials found in everyday products. They do not include any biomass other than paper and wood. Contrary to Technical Cycling, this category represents materials that can potentially be cycled but currently don’t come from secondary materials, whether in Brazil or abroad.
These inputs should be cycled into secondary inputs as much as possible.
What does this mean for Brazil?
Non-Renewable Inputs represent 8.9% or 400 million tonnes of Brazil’s total material consumption. The majority of these inputs are non-metallic minerals (58.1%) and metal ores (40.6%), with a small share of fossil fuels (2.3%). [84] This highlights significant circularity potential, indicating a large volume of materials that could be cycled but currently are not. These inputs are not inherently non-circular but are simply not being captured or recovered at scale today.
2. Non-circular rate
This category centres on fossil-based energy carriers, such as coal, oil and natural gas, among others. These fuels are burnt mainly for energy and, to a lesser extent, to produce chemicals and plastics. As they combust, they release GHG emissions into the atmosphere. These material inputs cannot be cycled and are therefore inherently non-circular.
These inputs should be minimised as much as possible.
What does this mean for Brazil?
Brazil’s Input Non-Circularity rate amounts to 3.1% or 100 million tonnes, representing about 2% of Brazil’s overall material use. While this share is relatively low, the associated environmental impact remains significant. Nearly all fossil fuels extracted in Brazil are used domestically (See Domestic material extraction)
Renewables supply 45% of Brazil’s primary energy demand, dominated by biogas (33%) and hydropower (~12%), with solar and wind contributing around 2%. Brazil’s electricity sector is among the cleanest globally, with hydropower accounting for about 80% of domestic electricity generation. [85] However, oil (37%), natural gas (8%), coal (4%), and nuclear (4%) still make up a substantial portion of the energy mix. [86] Although Brazil benefits from a clean grid and abundant renewable resources—including solar, wind, biomass, and hydropower—reliance on hydropower is vulnerable to droughts [87], deforestation, and transmission challenges. [88] Diversifying renewable energy sources is important to reduce overdependence on hydroelectricity.
Biofuels play a major role in transport, accounting for 22% of transport energy in 2022. Bioethanol makes up around 40% of gasoline-ethanol energy use, and biodiesel’s share in diesel energy grew to 9.3%. [89] Despite progress, Brazil’s transport and industry sectors remain dependent on non-renewable energy sources, highlighting the need to promote energy efficiency and further transition these areas. [90]
3. Non-renewable biomass inputs
Non-Renewable Biomass Inputs represent the share of primary biomass—such as trees, manure, food crops, or agricultural residues—that is not considered carbon-neutral, measured as a proportion of total material consumption.
These inputs should be minimised as much as possible.
What does this mean for Brazil?
Non-Renewable Biomass Inputs account for 19.2% of Brazil’s total material consumption—equivalent to 900 million tonnes, or 33% of the country’s biomass footprint. These inputs consist of non-carbon-neutral biomass, linked to unsustainable or carbon-intensive practices such as deforestation, land use change, and forest degradation. Historically concentrated in the Amazon and increasingly in the Cerrado, this trend is largely driven by agricultural expansion and intensification. [82]
Around 27% of Brazil’s land is used for agriculture, with three-quarters dedicated to permanent pastures and only one-quarter to arable land. [83] These land use patterns, combined with unsustainable farming practices, contribute to the depletion of renewable biomass capacity. While all biomass inputs have the potential to become renewable, doing so can require efforts to halt deforestation, promote reforestation and afforestation, and scale regenerative agricultural practices to protect ecosystems and maintain long-term material resilience.
Stock build up
This category includes a single indicator that measures the share of virgin material flows being added to global stocks—such as buildings, infrastructure, machinery, and vehicles—in net terms. These materials are locked into long-lived assets and unavailable as secondary material inputs for many years or even decades, with this delay creating a temporal gap or ‘lag’ in circularity.
Net additions to stock
Many of the materials that are needed to meet Brazil’s material demand feed into goods that remain in use for a relatively long time, such as buildings, infrastructure, consumer goods and vehicles. [91] These materials are added to the material reserves of an economy for longer than a year and are therefore referred to as Net Additions to Stock.
These inputs should be reused and cycled where possible to extend material lifetimes or reused as secondary materials.
What does this mean for Brazil?
Net Additions to Stock account for 28.2% of Brazil’s raw material consumption. Materials added to stock are primarily used in construction, consisting of non-metallic minerals (75.8%), metal ores (18.8%), and biomass (5.2%). Brazil’s share of biomass in net additions—about twice the global average—totals 1.3 billion tonnes, reflecting its growing urban and infrastructure development. The high proportion of non-metallic minerals indicates large-scale construction activities typical of countries experiencing rapid urbanisation and infrastructure expansion.
As Brazil’s population is projected to grow by 7% by 2050, [92] continued urban and infrastructure growth is expected. If pursued with circular principles, this increased stock could enhance future secondary material outputs, boosting the circularity of materials in use.
The Circularity Gap Report is an initiative of Circle Economy, an impact organisation dedicated to accelerating the transition to the circular economy.
© 2008 - Present | RSIN 850278983