
Brazil


Carbon footprint
Measuring a country’s material footprint offers valuable insight into the scale and origin of its resource consumption—but it does not capture the full picture of environmental impact. To understand the climate implications of material use, it is equally critical to account for the emissions associated with the production and consumption of goods and services. This is where consumption-based carbon footprinting plays a vital role. Unlike production-based accounting, which only measures emissions generated within national borders, consumption-based carbon accounting captures the full spectrum of GHG emissions: those embedded in imports and exports—regardless of where they occur (see Figure ten). This offers a more accurate reflection of a country’s contribution to global emissions, particularly for economies that rely heavily on global supply chains.
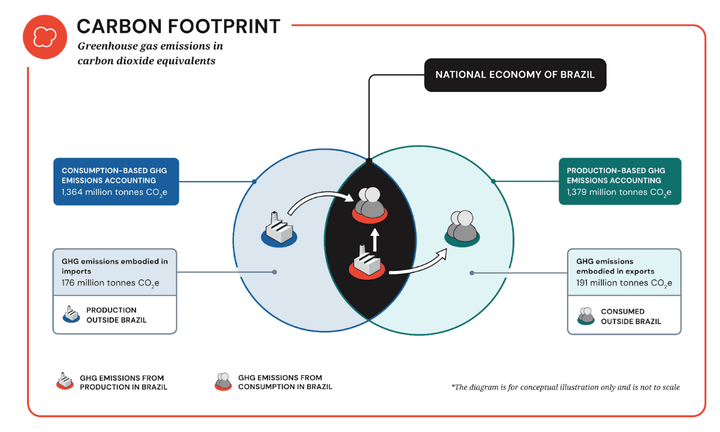
Figure ten displays consumption-based and production-based approaches to Brazil’s carbon accounting.
Brazil’s consumption-based carbon footprint stands at approximately 1.36 billion tonnes of CO2e. Brazil is a carbon-intensive economy, primarily due to emissions from the nutrition, services, and manufactured goods provisioning systems.
Unlike many industrialised economies, Brazil’s emissions are less driven by fossil fuel combustion and more by land use change, agriculture, and resource extraction.
When considering domestic, production-based emissions, Brazil ranked among the top six emitters in 2022—alongside China, the US, India, the EU27, and Russia. [68] These countries together accounted for more than 60% of global GHG emissions. [69] To better understand the consumption-based approach used see Appendix A under Methodology document.
Brazil’s consumption-based carbon footprint per capita is approximately 6.5 tonnes of CO2e —just above the global average of 6 tonnes and well below the EU average of 10.7 tonnes. With 2.6% of the world’s population and 2.5% of global anthropogenic emissions, Brazil’s per capita footprint is relatively aligned with its share of the global population. Compared to its BRICS peers, Brazil has the second-lowest carbon footprint per capita at 6.5 tonnes of CO2e—well below Russia (12.3 tonnes), China (10.8 tonnes), and South Africa (6.9 tonnes). Only India registers a lower per capita footprint, at 2.8 tonnes (as shown in Figure 11).
Figure 11 shows the per capita carbon footprint, 2023.
The vast majority of Brazil’s GHG emissions—around 87%, or 1.2 billion tonnes of CO2e—originate within the country itself.
These are Brazil’s territorial emissions, contrasting with 12.9% of emissions embodied in imported goods, reflecting carbon-intensive activities abroad linked to Brazil’s production and consumption. [70] [71] Differentiating between territorial and embodied emissions is important: territorial emissions capture what is released within Brazil’s borders, while embodied emissions account for the environmental impact of imported goods.
Carbon footprint by provisioning system
Figure 13 shows carbon footprint by provisioning system, 2023.
Brazil’s carbon footprint can be attributed to seven sectors of final demand, each representing a societal need: Housing and Infrastructure, Services, Mobility, Nutrition, Manufactured Goods, Healthcare and Education, and Communication. Figure 13 illustrates the ultimate destinations of materials within these sectors, offering a clear picture of the interplay between resource use and societal demands.
Other smaller contributors include healthcare and education at 32.1 million tonnes and communication at 20.9 million tonnes. Direct emissions reflect those generated by the final demand of households, government, and nonprofit organisations through activities such as driving, heating, appliance use, and other daily consumption.
The Circularity Gap Report is an initiative of Circle Economy, an impact organisation dedicated to accelerating the transition to the circular economy.
© 2008 - Present | RSIN 850278983