
Brazil


Material footprint
The material footprint is a widely used consumption-based indicator that captures the total amount of raw materials embodied across the entire supply chain to meet an economy’s final demand for goods and services. It provides a comprehensive view of consumption patterns—regardless of where resource extraction, processing or disposal occurs. To better understand Brazil’s role in global material flows, we also consider the production-based perspective.
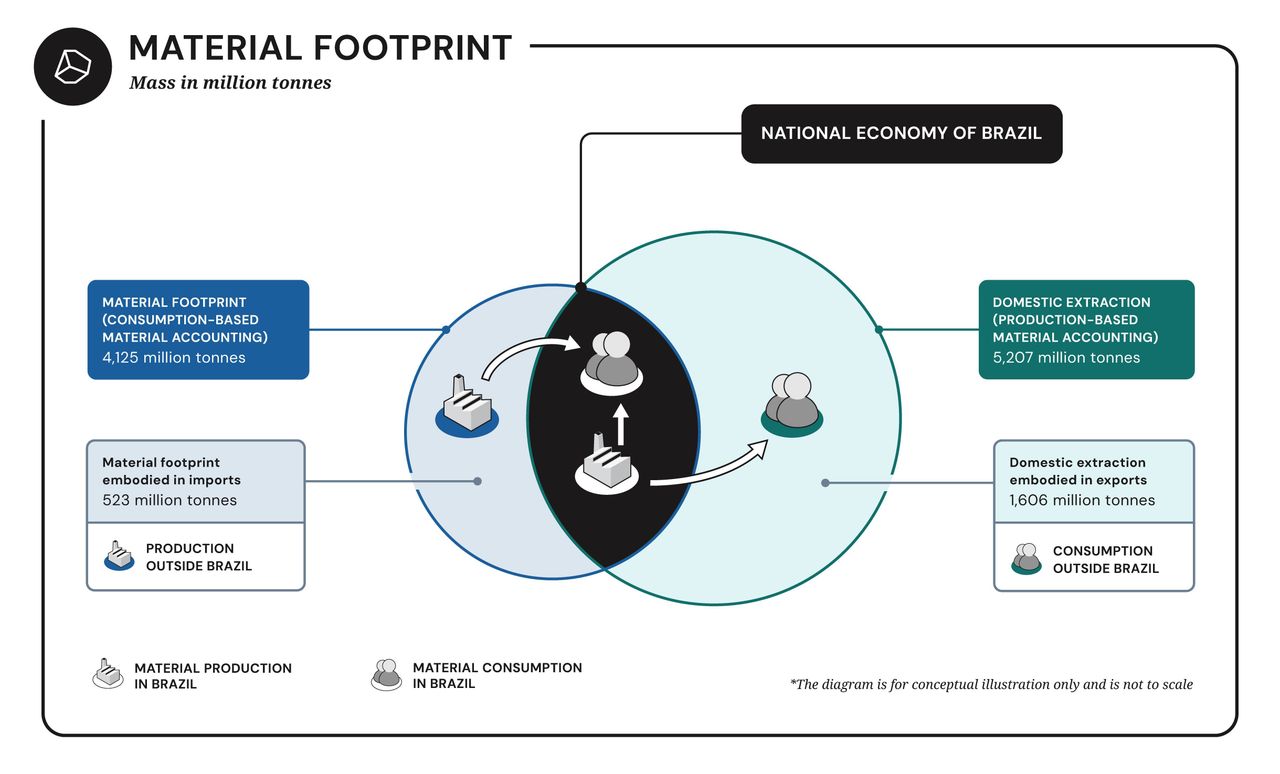
Figure eight displays consumption-based and production-based approaches to Brazil’s material accounting, 2023.
Brazil is a major global consumer of materials, driven largely by agriculture. In 2023, each person in Brazil used about 19.8 tonnes of materials—well above the global average (12.6 tonnes) and more than double the sustainable level (8 tonnes). [64] This adds up to a total material footprint of 4.26 billion tonnes, even though Brazil has just 2.6% of the world’s population.
Most of Brazil’s material use comes from biomass (12.9 tonnes per person), reflecting its large agricultural sector. Compared to other BRICS countries, Brazil’s per capita footprint is the second highest, after China, and far ahead of India, Russia, and South Africa.
Figure six shows Brazil’s material footprint breakdown by material group, 2023.
Click on the pie chart to explore more data.
Biomass dominates Brazil’s material footprint, accounting for 64% (2.72 billion tonnes), primarily grazed biomass, sugarcane, and crop residues such as feed and straw. This composition reflects extensive livestock farming and crop production, particularly for feed and bioenergy, with sugarcane serving both food and biofuel (ethanol) functions within the national energy system. Non-metallic minerals follow at 26%, mainly sand, gravel, limestone, gypsum, and chalk, indicating significant demand for construction materials. Fossil fuels represent 6%, primarily crude oil and natural gas, while metal ores account for 3.9%, largely iron, gold, and copper. The material groupings are illustrated in Figure six.
Material footprint by region of origin
Brazil’s material footprint is largely domestic in origin: over 3.6 billion tonnes (of the 4.26 billion total) or around 90% of raw material stems from within its own borders. Biomass alone accounts for 2.57 billion tonnes. Given that a substantial share of Brazil’s material footprint is generated domestically, the country retains a comparatively higher degree of control over its resource use—unlike countries where consumption is heavily reliant on imported, and often opaque, supply chains. Non-metallic minerals (784 million tonnes), fossil fuels (147 million tonnes), and metal ores (99 million tonnes) follow in terms of volume.
Asia and Oceania provide the largest external contribution—just under 300 million tonnes, mostly in the form of non-metallic minerals. China is both a key import and export partner. Top imports into Brazil include refined petroleum, cars and other motor vehicles, and industrial equipment. [65] Latin America also contributes 145 million tonnes to Brazil’s footprint, mainly biomass. These flows highlight regional economic integration, while also pointing to how imported materials can externalise environmental and social pressures abroad.
Figure seven depicts the material footprint by country of origin/regional contributions to material footprints, 2023.
The contrast between Brazil’s production- and consumption-based material footprints highlights its role in global supply chains. For most material groups—biomass, non-metallic minerals, and metal ores—per capita production exceeds consumption, indicating a substantial share is exported. Biomass shows 13.27 tonnes produced versus 12.9 consumed per capita; non-metallic minerals, 5.86 versus 5.25; and metal ores, 1.96 versus 0.8—the widest gap. These disparities underscore Brazil’s role as a net exporter of raw materials. Fossil fuels deviate from this trend, with a higher consumption-based footprint (1.22 tonnes per capita) than production-based (0.75), reflecting reliance on imported or refined energy products.
Brazil’s domestic extraction exceeds its material footprint by roughly one billion tonnes, pointing to low dependence on foreign resources.
However, this does not equate to full self-sufficiency: the country still imports processed minerals, agricultural inputs, and industrial components. While exporting large volumes of raw materials—soy, sugar, metal ores—it remains reliant on imports for industrialised and high-tech goods. Figure eight compares Brazil’s production- and consumption-based material accounts, highlighting the country’s dual identity as both a major extractor and consumer.
Material footprint by provisioning system
Brazil’s material footprint can be attributed to seven sectors of final demand, each representing a societal need: Housing and Infrastructure, Services, Mobility, Nutrition, Manufactured Goods, Healthcare and Education, and Communication. Figure nine illustrates the ultimate destinations of materials within these sectors, offering a clear picture of the interplay between resource use and societal demands.
Figure nine depicts the material footprint by provisioning system, 2023.
The Circularity Gap Report is an initiative of Circle Economy, an impact organisation dedicated to accelerating the transition to the circular economy.
© 2008 - Present | RSIN 850278983